
 One of the important thing would be, communicate the results of the visual patterns that you discover. What are the four kind of relationships that you want to show, one you want to show what is the minimum value, what’s the maximum value and the average. You want to show the distribution patterns, rank patterns, you want to look at contribution for example how much does Karnataka contribute to alcohol consumption. You want to see a percentage of the whole and want to find out Deviations say last year Karnataka was contributing 30% now its contributing 25% is this because they are more outlets. These are the four operations one would perform while doing analysis.
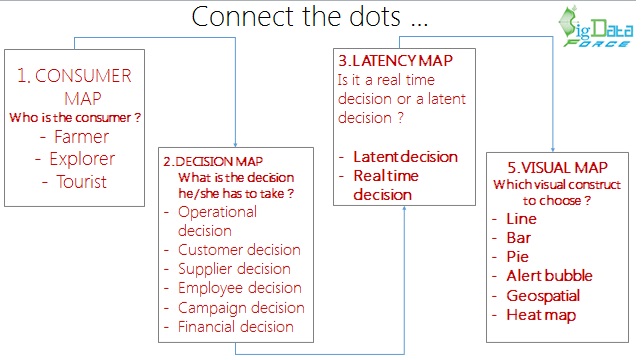
If you have to have a way of connecting all these dots together. So if you are trying to design a dashboard the four typical steps that you will take, who is the consumer are you designing the dashboard for a farmer, explorer or tourist. The second factor taken into consideration will be what is the decision she has to take, weather it is operational decision, supplier decision, financial decision etc. Once you map the decision, which the data science visualization process enables then you can map the latency associated with that, real time decision versus latent decision. Fourth one you can figure out which visual construct you want to apply.
What are some of the best practices in Designing dashboards and scorecards ?

Author Bio:
Mahesh Kumar CV is A Big Data Entrepreneur, ChiefExecutive Officer & Founder at Big Data Force Pvt Ltd. I have about 14 years of experience in architecting and developing distributed and real-time data-driven systems. Currently my focus is on ensuring that my customers are happy, by addressing their business problems through robust data platforms that are fuelled by the advances in Big Data technologies and algorithms. Provided thought leading, practical, cutting edge solutions in the areas of BI,Big Data Analytics , In Memory Computing, Analytics to transform Fortune 500 Clients to deliver higher performance. Achieved great results for many clients through consulting and solving complex decision making environments. Specialties: translating big data into action, Big Data Trainings, Product Engineering Services, and Building Big Data CoE & Big Data Incubators. Specialties: Big Data Transformations (Strategy, Value Articulation, Architecture, Assessments, Portfolio analysis and rationalization), Information Management, Innovation.


